OpenCap 2.0 - Field Evaluation
8 min
This is the second part of our field test of the OpenCap software. Part 1 is available at https://www.releasebyfelis.com/opencap/ and covered the initial set-up and workflow of OpenCap, its usability in a real-world gym environment, and the practical challenges of using markerless motion capture outside a controlled laboratory setting. The key finding was that environmental control — particularly background interference — significantly affects data quality. Based on those limitations, we returned for a second, more optimised field test. That is what you are reading now.
Following the issues encountered during our first field test, we addressed the environmental limitations and resolved the technical problems before conducting a second, more controlled session.
Data capture was noticeably smoother as a result. Testing took place in a private gym area with a plain white wall background. The camera was positioned approximately 3 metres from the athlete at a 15° angle, mounted on a tripod at roughly 40 cm height, under artificial lighting. A MacBook was connected to the OpenCap web app to manage recording and upload videos directly to the server. It is worth noting that OpenCap recommends positioning the camera at a 30°–45° angle to the athlete.
We recorded two athletes, each performing three sets of three repetitions of a classic back squat. Athletes warmed up individually for five to ten minutes before beginning. The first set used only the barbell. The second set was performed at 60% of 1RM, and the third at 75% of 1RM. This loading progression was chosen deliberately: movement deficits tend to become more apparent under load, as increased muscle and joint demands are more likely to expose technical compensations.
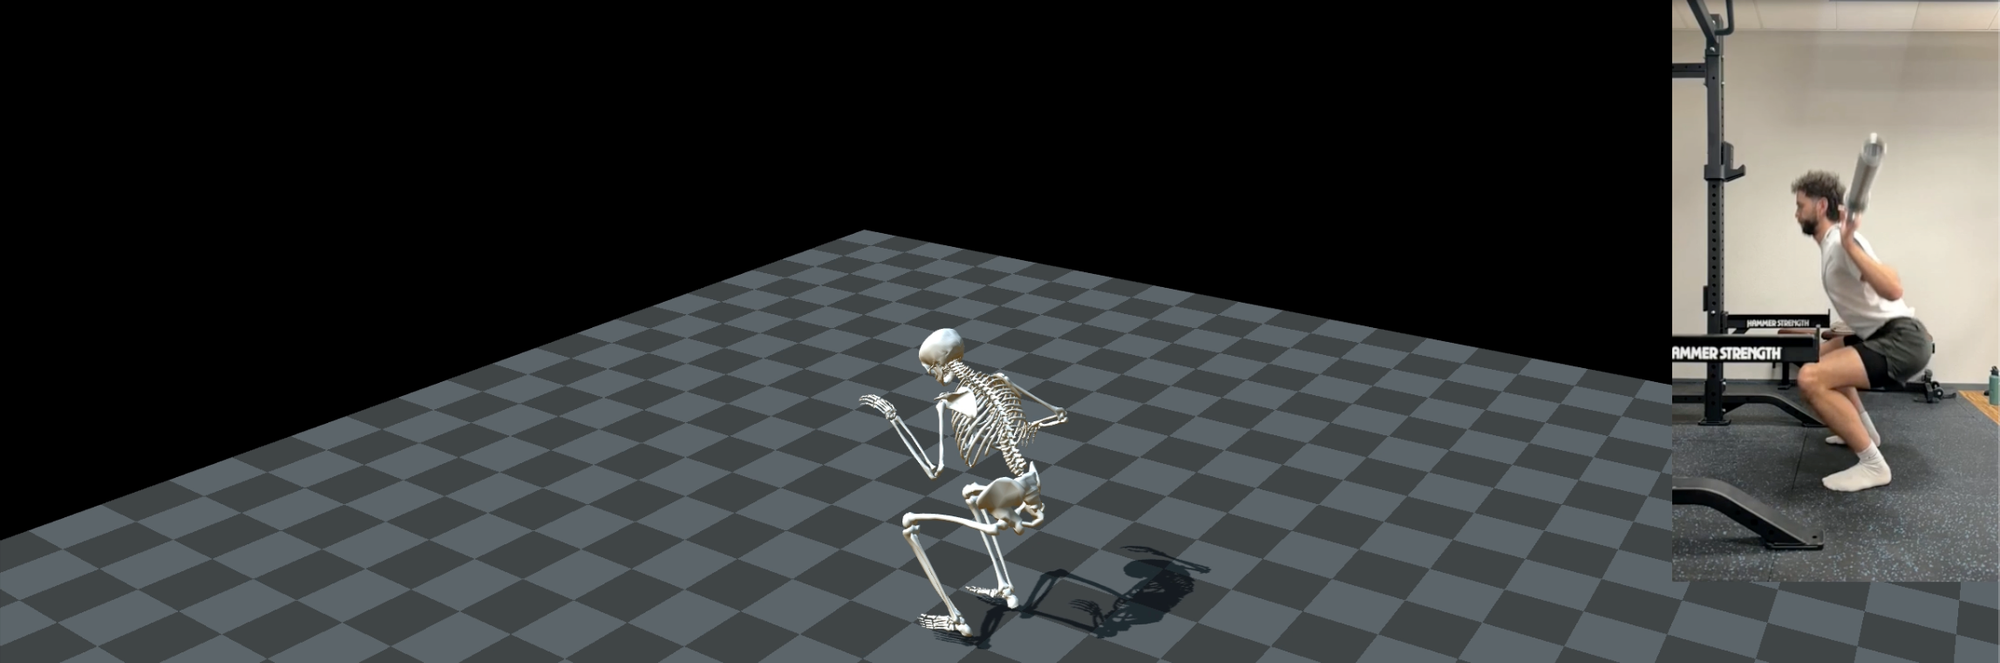
After finishing the recording of a session, all trials and videos are uploaded to the cloud and stored within the designated session. Users can then access their sessions via the dashboard and select individual trials for visualisation and further analysis (Figure 1). The 3D model viewer operates in a 360° free mode with zoom functionality. It is intuitive to use and adds genuine value to the analysis process. Of the nine trials recorded, two could not be analysed due to incomplete video uploads. Among the successful trials, a consistent issue emerged: the 3D skeletal model struggled to accurately represent the right elbow of participants (Figure 1). This is most likely a consequence of using a single camera in portrait orientation, which focuses on one side of the body. Whilst elbow position is of limited relevance during a squat, the error raises broader concerns about the accuracy of joint estimates on the camera-far side — in this case, the right side of the body.
From a time-management perspective, OpenCap is more scalable than it might initially appear. Once the environment is set up and the workflow is standardised, individual trials upload in 20–30 seconds. Testing an entire squad is feasible within half a day. Multiple athletes can be recorded within the same session, and analysis is conducted after testing is complete, meaning there is no real-time bottleneck on the day.
OpenCap offers several options for analysing captured data (Figure 2). From the bottom-left tab within a session, users can either download the data as a ZIP file or open the kinematics dashboard.
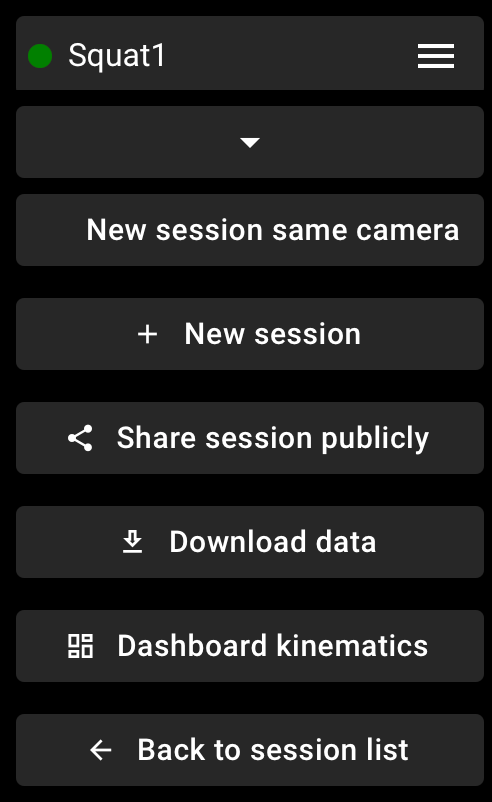
The ZIP download includes the raw camera footage — without the 3D overlay — which can already serve as useful visual feedback for coaches and athletes. However, the analytical files within the archive are exported in .trc, .mot, .vtp, and .osim formats. These require specialist software to open and are therefore inaccessible to most practitioners without additional tools.
The kinematics dashboard, by contrast, is more immediately usable. It allows the user to select a specific session, subject, and trial, then choose from 33 biomechanical markers placed on the subject's 3D model. These include variables such as hip flexion, hip rotation, pelvic tilt, arm flexion, and lumbar extension, among others.
Figure 3 shows an example of a side-to-side hip flexion comparison during a standard barbell squat (blue = right hip; green = left hip). The X-axis represents time, across which three squat repetitions are clearly visible over approximately 15 seconds. The Y-axis shows hip flexion angle, ranging from 0° to 120°. The symmetry between sides is easy to read at a glance.
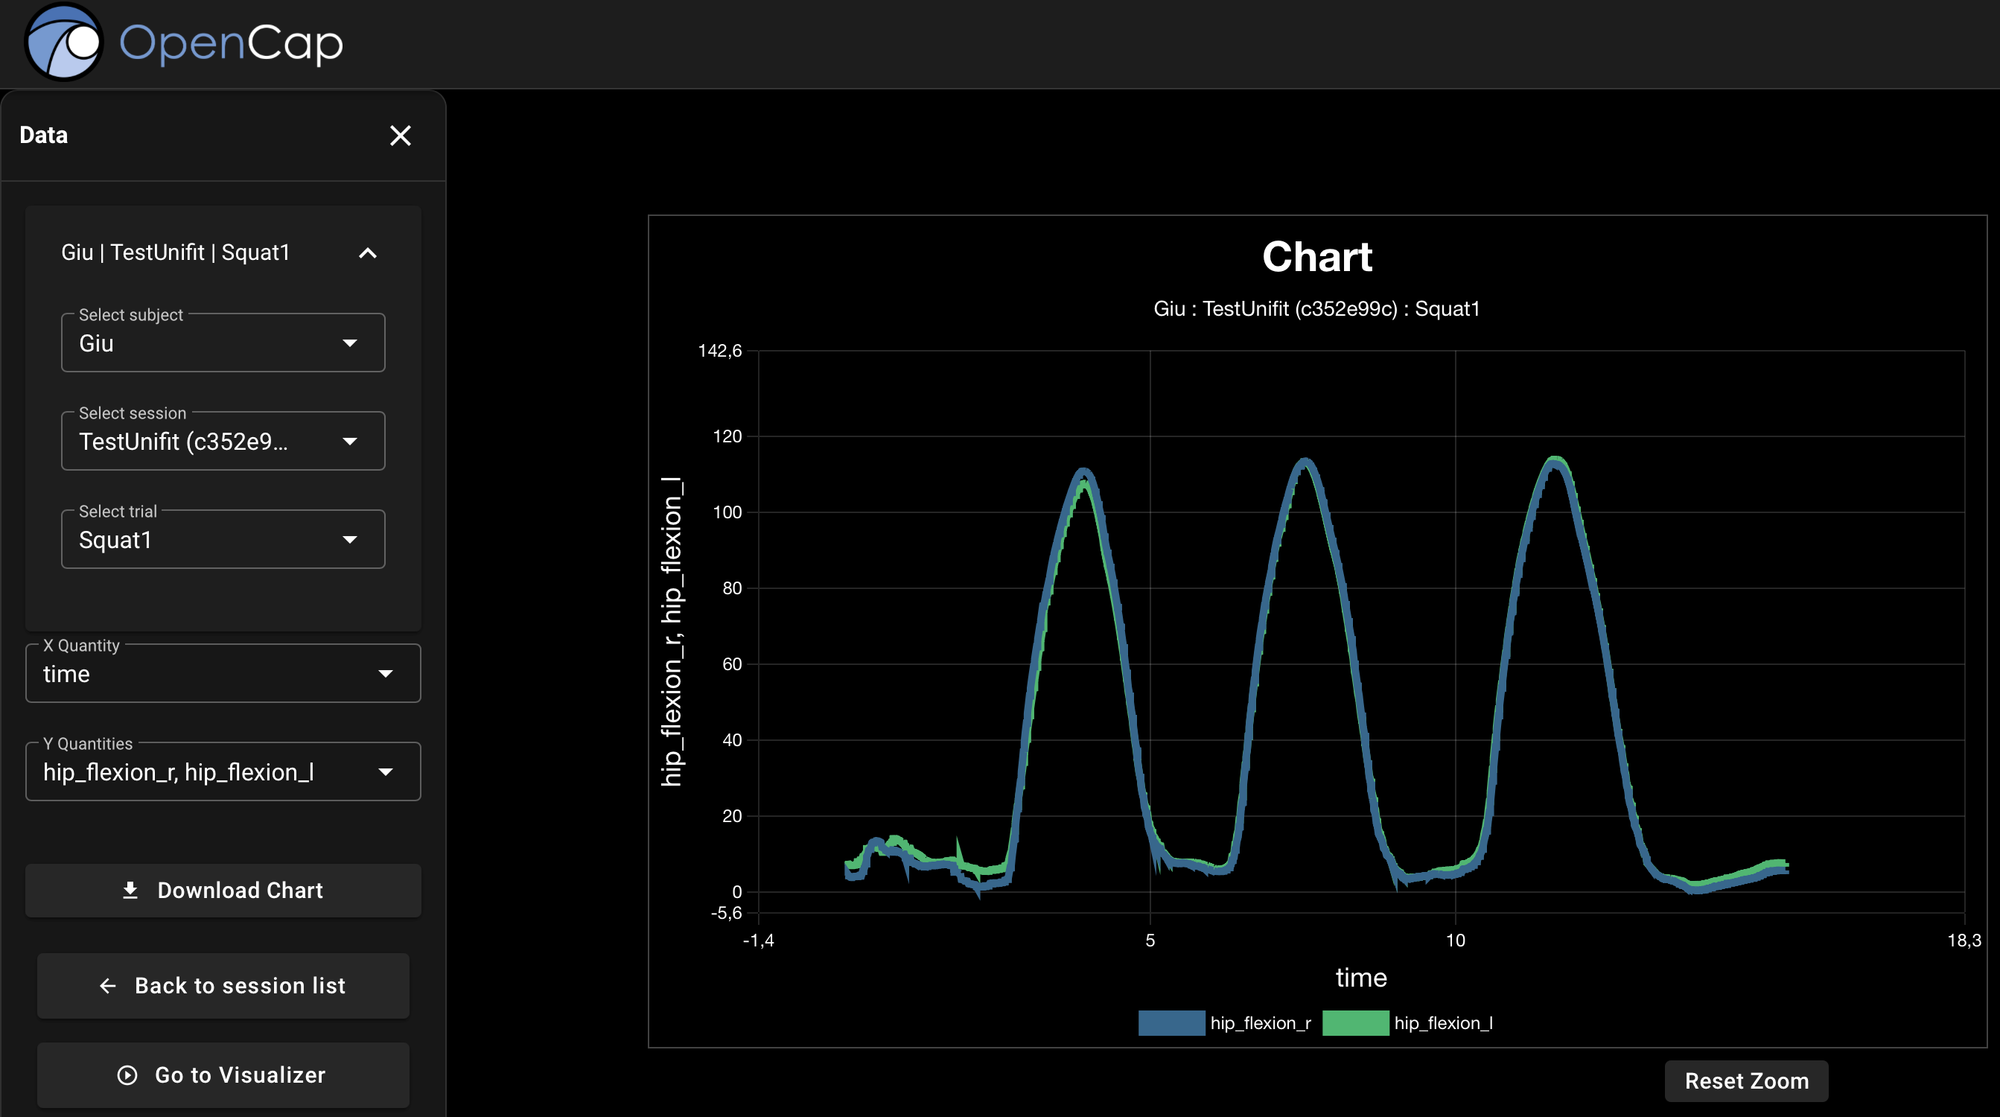
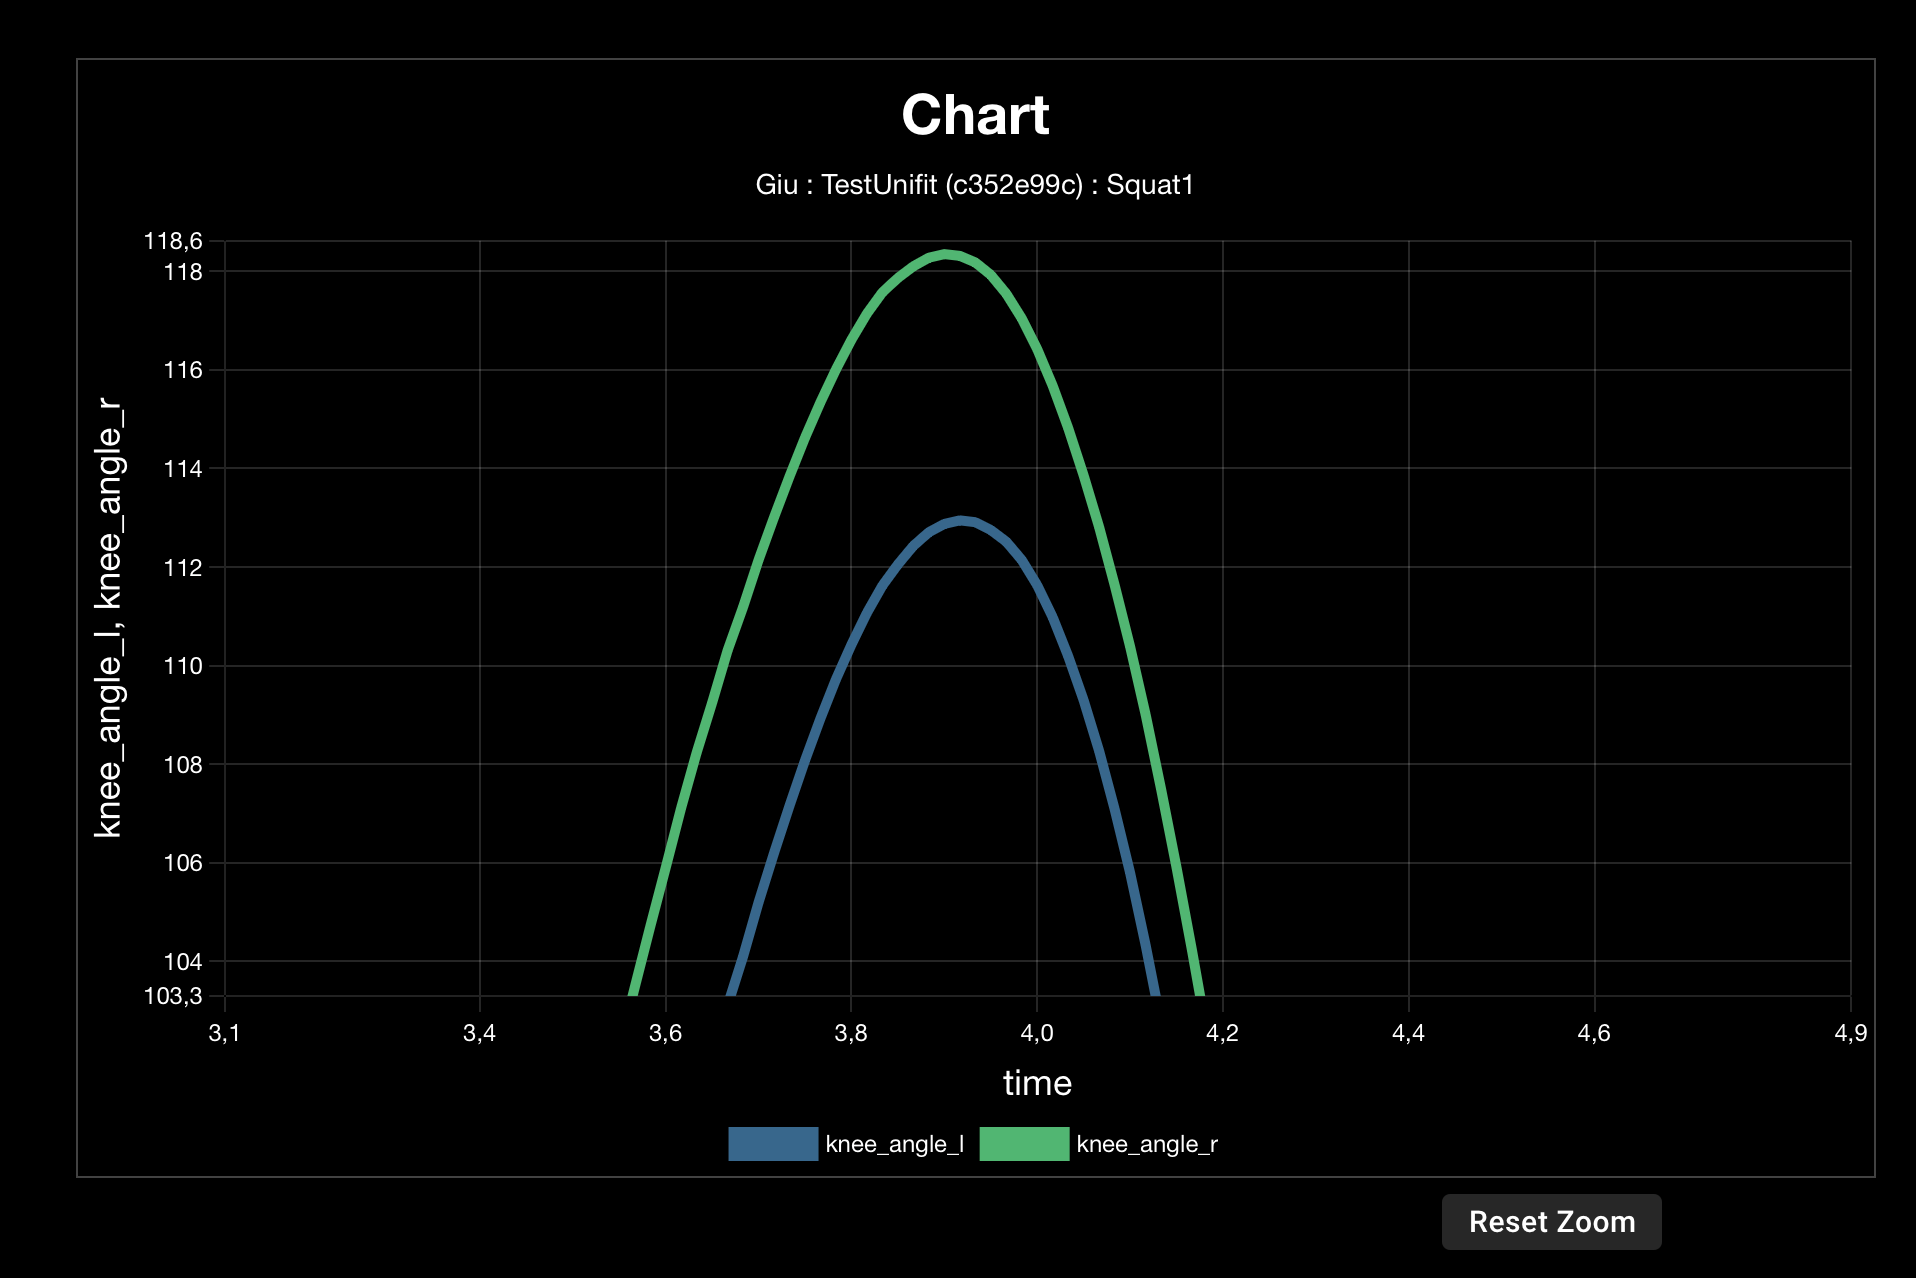
Figure 4 illustrates a more clinically relevant finding: a side-to-side difference in knee flexion angle at the deepest point of the squat. The right knee reached a maximum angle of 118.6° (blue), whilst the left reached 113° (green) — a difference of approximately 6°. On the basis of these values, practitioners can identify asymmetries, provide objective feedback, and target movement quality improvements.
In practice, this type of finding can be interpreted in several ways. Whilst further testing is needed to confirm or refute any specific cause, the following hypotheses are worth considering:
a) Limited right ankle mobility. Restricted ankle dorsiflexion can prevent the right leg from reaching the same squat depth as the left, resulting in a larger knee angle at maximal depth. Dorsiflexion range-of-motion testing serves as a straightforward diagnostic step. If a deficit is confirmed, ankle mobility work should be integrated into training, and compensatory techniques (such as heel elevation) may be used in the interim.
b) Limited right knee mobility. Restricted knee flexion range of motion in the right leg could also explain the asymmetry. A prone knee flexion test is a simple first-line screen. If positive, additional muscle testing — passive, active, and dynamic — should follow to identify any co-existing strength deficits.
c) Asymmetric muscle strength. Side-to-side strength differences in the primary squat muscles — the quadriceps (rectus femoris, vastus lateralis, vastus medialis, and vastus intermedius), gluteus maximus, and adductor magnus — could lead to compensatory movement strategies. Biomechanically, load on these muscles is highest at peak knee flexion. Reducing squat depth on one side effectively limits joint loading, which may represent a subconscious compensation for weakness or fatigue. Further testing would be needed to identify the specific muscles involved.
d) Pain or injury history. Practitioners should always consider the possibility that restricted movement reflects guarding behaviour linked to pain, a recent injury, or an apprehension about loading a particular structure. This should be explored through direct conversation with the athlete and, where relevant, clinical assessment.
Several limitations must be acknowledged.
First, the underlying mechanics of OpenCap's 3D reconstruction algorithm are not publicly explained. As a markerless, AI-based system, some degree of measurement error is inevitable — and this is compounded by the fact that single-camera mode has not yet been formally validated. Observed asymmetries may therefore reflect true differences, measurement artefacts, or noise.
Second, there are no landmark descriptions available to explain where each biomechanical marker is anatomically anchored. Without this information, practitioners cannot reliably interpret outputs. Terms such as "lumbar extension" or "lumbar bending" are ambiguous and could be defined in multiple ways, with meaningful consequences for clinical interpretation.
Third, the accuracy of single-camera estimates for the camera-far side remains questionable. As illustrated in Figure 1, the AI model incorrectly rendered the subject's right arm — displaying the hand hanging downwards rather than gripping the barbell. This error is a visible reminder of the system's current limitations in estimating contralateral-side kinematics. Although this might have been influenced by our camera angle position being below the recommendation.
OpenCap represents a genuinely interesting development in accessible motion capture. Its ability to generate kinematic data from a single smartphone, without the need for markers or a laboratory environment, is a meaningful step forward for applied sports settings. The kinematics dashboard is well designed, and the side-to-side comparison tools offer real diagnostic potential for coaches working with athletes on movement quality.
That said, the platform is not yet ready for use as a primary analytical tool in elite performance environments. The single-camera mode remains unvalidated, the export formats are inaccessible without specialist software, and the absence of anatomical landmark descriptions limits confident interpretation of results. Upload failures and occasional 3D model inaccuracies add further friction in the field.
For football practitioners OpenCap may be most useful at this stage as a supplementary screening tool: a low-cost, low-barrier way to flag gross movement asymmetries and generate objective discussion points. It should not replace validated assessment methods, but it can complement them. As the platform matures and single-camera validation data become available, its practical value in the day-to-day applied setting is likely to grow considerably.
One of the most common questions practitioners ask when evaluating a new technology is simple: how long does this actually take? To answer that as concretely as possible, we have broken the OpenCap workflow down into its individual steps in the table below, including estimated time requirements and practical recommendations for each (see below).
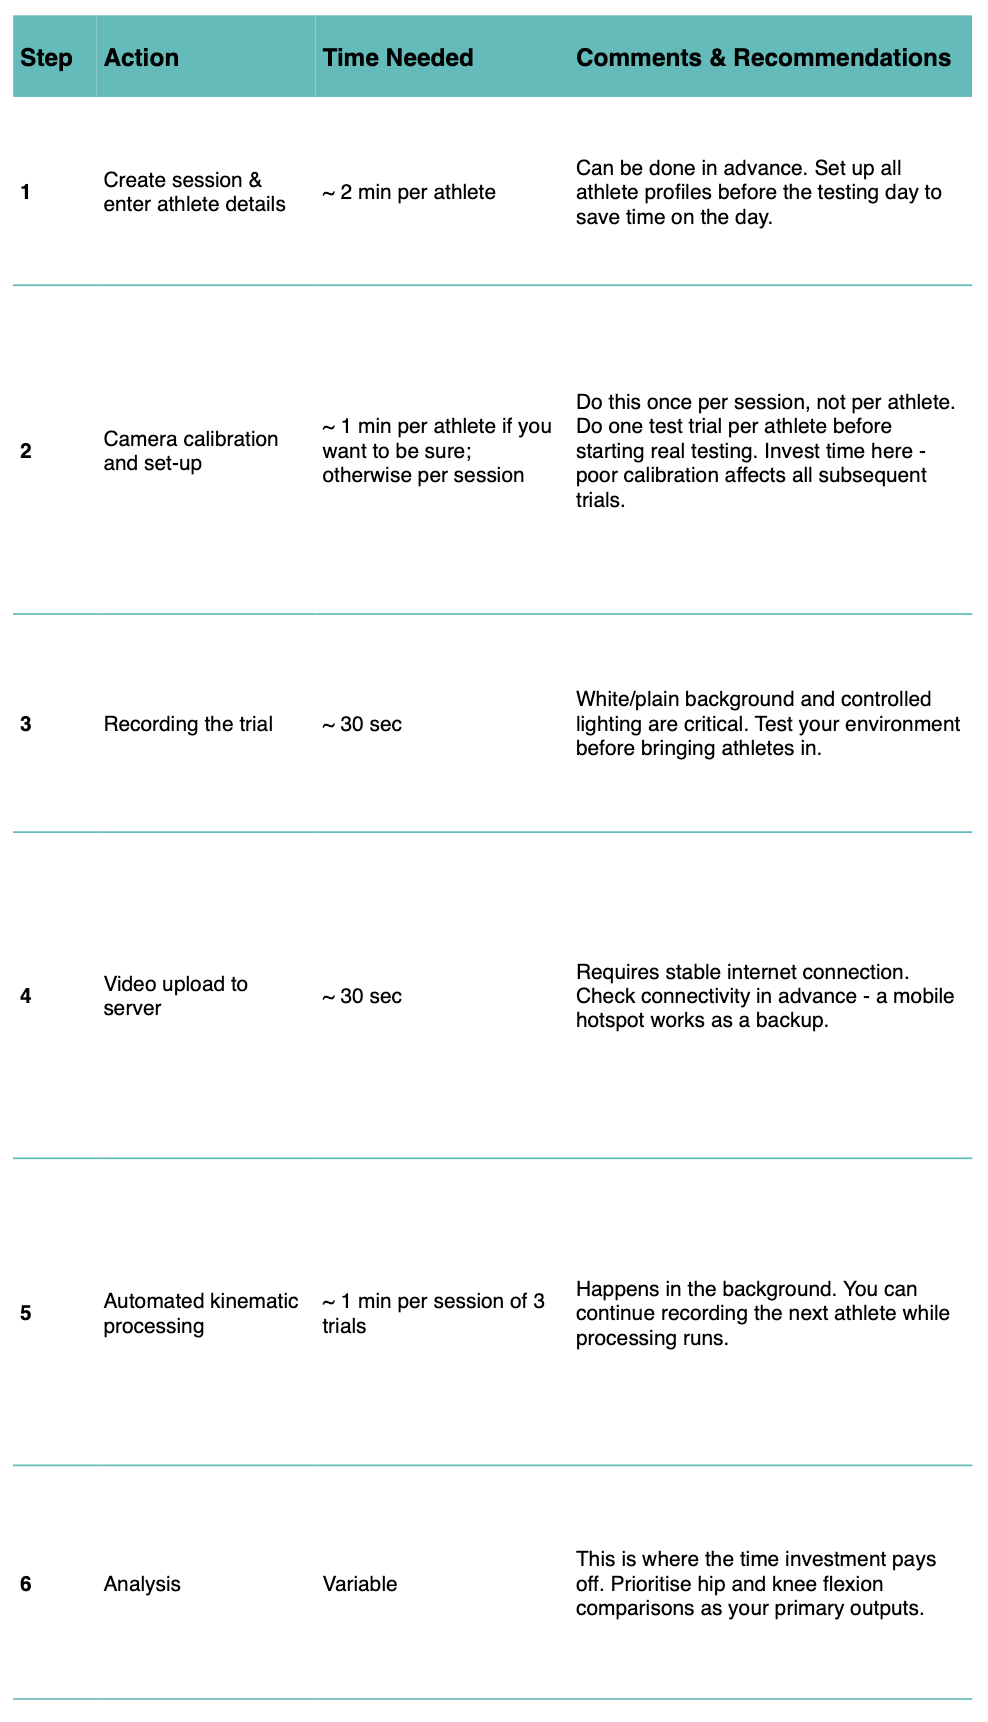
Following the step-by-step overview, we then applied these estimates to a realistic applied scenario: screening a full football squad of 25 players for the barbell squat in a single day, including a preliminary kinematic analysis of two to three pre-selected metrics per athlete. The goal is to give practitioners a honest, ground-level picture of what adopting OpenCap as a screening tool actually demands in terms of time and staffing — before committing to it on a training day.
Rough time calculation for a 25 player squad
| Step | Time per athlete | Total (n=25) |
|---|---|---|
| Recording 3 trials | ~3 min | ~75 min |
| Upload per athlete (3 trials × 20–30 sec) | ~1.5 min | ~37 min |
| Preliminary dashboard check (2–3 metrics) | ~5 min | ~125 min |
| Total | ~9.5 min | ~237 min |
We would like to remind our readers that OpenCap is free for use in non-commercial research and education. We also underline that commercial or professional performance applications may require separate licensing or collaboration agreements and interested teams should contact the OpenCap team to clarify permitted use cases.